
All the pages are already there but simply not shown in the menu. Have a look at our model or visit the safety page. You can also visit the attributions or contribution pages.
Make your plots here
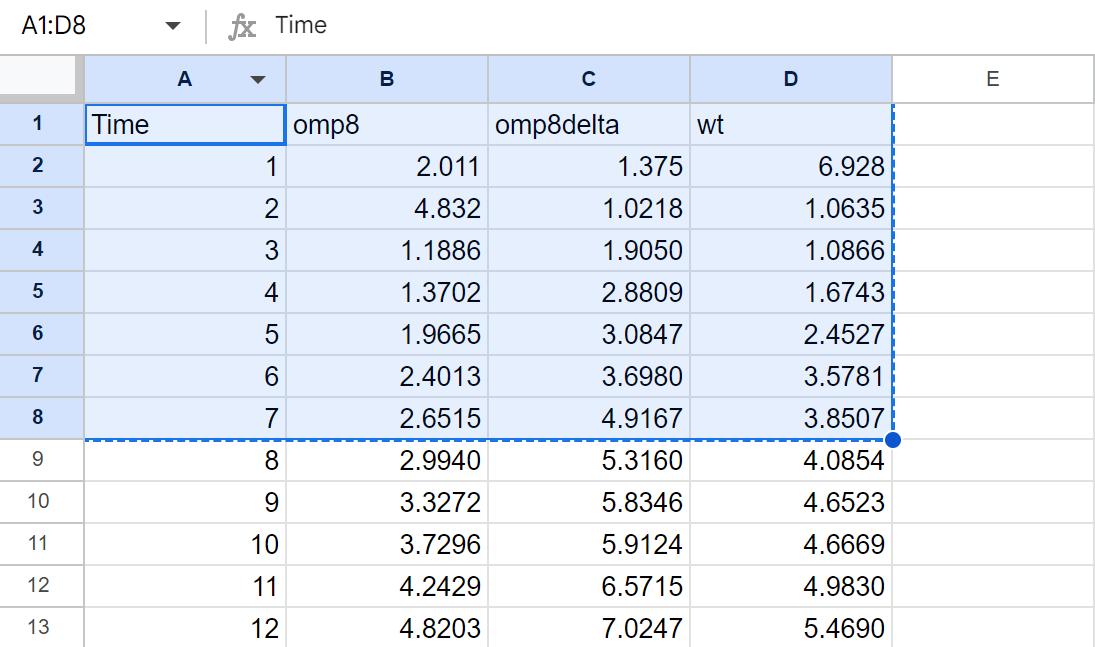
copy your data out of your docs sheet (i dont know if excel works as well you can try and tell me) and paste it in the pink input field, then press plot data
the picture is for demonstration, you can choose how many columns you want, but the first column is the x-values.
Also dont use , use . instead
If you already have used , instead of . dont panic and read THIS:
Orga
Make tables
| Category 1 | Category 2 |
|---|---|
| Entry11 | Entry12 |
| Entry21 | Entry22 |
Use html
This type of usage is disallowed! Because we need to use the url from igem and we are also not allowed to use iframes in general.
This is totally fine!
asdf
test for different heading levels
and another test
Write code
#include <stdio.h>

int main() {
    return 0;
}
or some julia maybe?
function mandelbrot(a)
    z = 0
    for i=1:50
        z = z^2 + a
    end
    return z
end